Oil Price Watch
Overview
At different times I have conducted an "Oil Price Watch" (as well as sometimes looking at the behaviour of other commodity markets), examples of which are archived here. The idea was to monitor what happens to the price of oil on a week by week basis as reported in the Financial Times and see to how this market can help illustrate basic economic principles.
What I personally found useful in looking at these issues in this way was that five basic issues kept on recurring as essential for understanding what was happening in these markets, and these issues were remarkably similar across a wide range of commodity markets, including oil. A sixth issue (short run and long run effects) is also useful to bear in mind:
Issue (1): Intentions: it is a mistake to think of supply as actual production and actual demand as actual consumption (which is how they are often portrayed in the press). In fact, both supply and demand represent intentions, or willingness to trade.
Issue (2): Inelasticity: the movements recorded daily in the Financial Times (FT) are short term movements so both supply and demand schedules are highly (price) inelastic, that is, just modest movements in the supply and/or demand curves left or right have have major effects on prices..
Issue (3): Expectations: what is expected to happen to the price of a commodity in the future will have knock-on effects on the price today. Issue (3a):Expectations of price rise: if new information suggests that the future price of the commodity could rise, say next month or next year (eg because something is now expected to shift future supply curve to the left, or demand curve to the right), this will encourage producers to hold back some what they would have supplied today, in the hope of higher profits in the future (present supply curve shifts left), while those consumers who have the discretion to do so will increase their demand in the present to try to avoid being exposed to these higher prices in the future (present demand curve shifts right). And if supply shifts left and/or demand shifts right today, prices go up today. Issue (3b):Expectations of price fall: if new information suggests that the future price of the commodity could fall (eg because new information suggests something is now expected to shift future supply curve to the right, or demand curve to the left) similar reasoning will lead to the supply curve shifting right in today's market while the demand curve will shift left in the market for oil today, leading to a fall of the price of the commodity today.
In a very real sense, commodity markets today echo the future.
Issue (4): Stocks: when I did first year economics I was taught that it is flows of goods and services that matter, not stocks, in determining prices. So one of the puzzles that I came across in the commodities pages of the FT was why stocks (or even just reports of stocks) of goods (e.g. strategic reserves) can be so important in influencing prices. The reason is that what are stocks now could become flows in the future. And if stocks are (reported to be) low now, then the expectations of pressure upwards on price next year because the commodity could be in scarce supply are heightened (and from Issue 3a above, if they think that prices will go up in the future then they will go up now) while if stocks are (reported to be) abundant now, then the expectations of downward pressure on prices next year are correspondingly increased (and as we know from Issue 3b, if traders think prices will go down in the future, then they go down now). So stocks can matter because they can affect expectations of future prices, and as we saw in Issue 3, commodity market prices today tend to echo future prices.
Issue (5): Limted effectiveness of cartels: in principle, it would be in the collective interest of OPEC's members if the cartel would control prices to maximise profts of its members, fix aggregate supply to set that profit maximising (monpoly) price, and allocate quotas to its individual members consistent with achieving that target aggregate supply. Only one problem with this - the free rider. Each member of the cartel may have an incentive to free ride on the collective decision of the cartel and pursue its own self interest, while sanctions against free riders may be weak or non-existent. This is why OPECs record on controlling prices and outputs is at best mixed.
Issue (6): Long run and short run effects
|
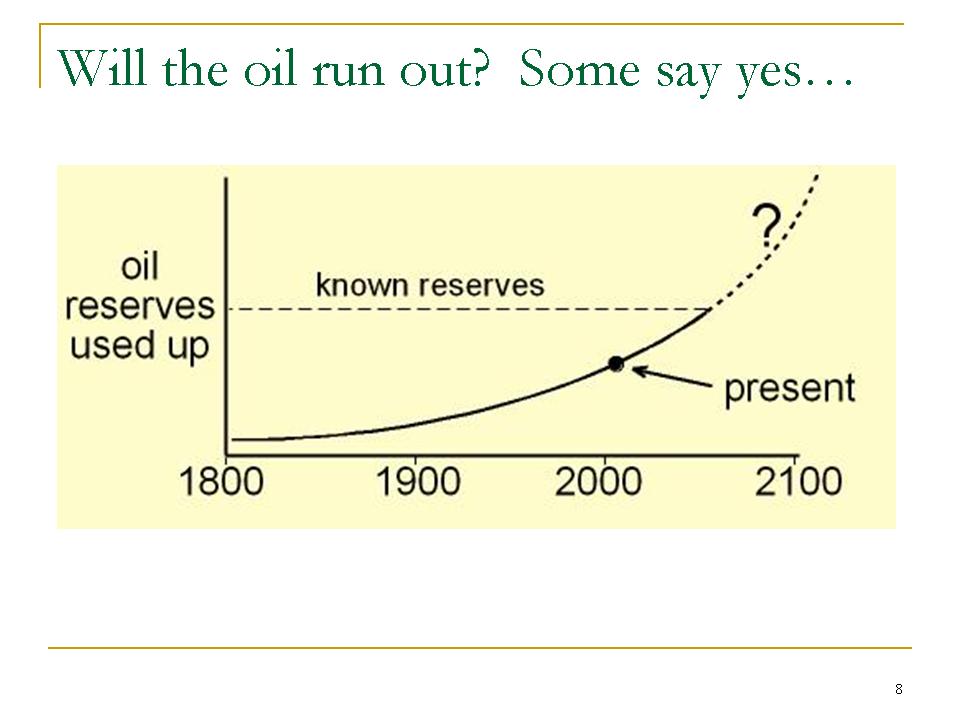
We shall be looking mostly at short run effects, but the price of oil will also have important long run implications Here is a long run prediction .....
Looks bad? But economists see high price of a commodity as not just a problem in itself but as creating incentives to help solve or mitigate problems of scarcity. We know that global production peaking together with surging Asian-led demand for commodities like oil will create these incentives in the longer term. |
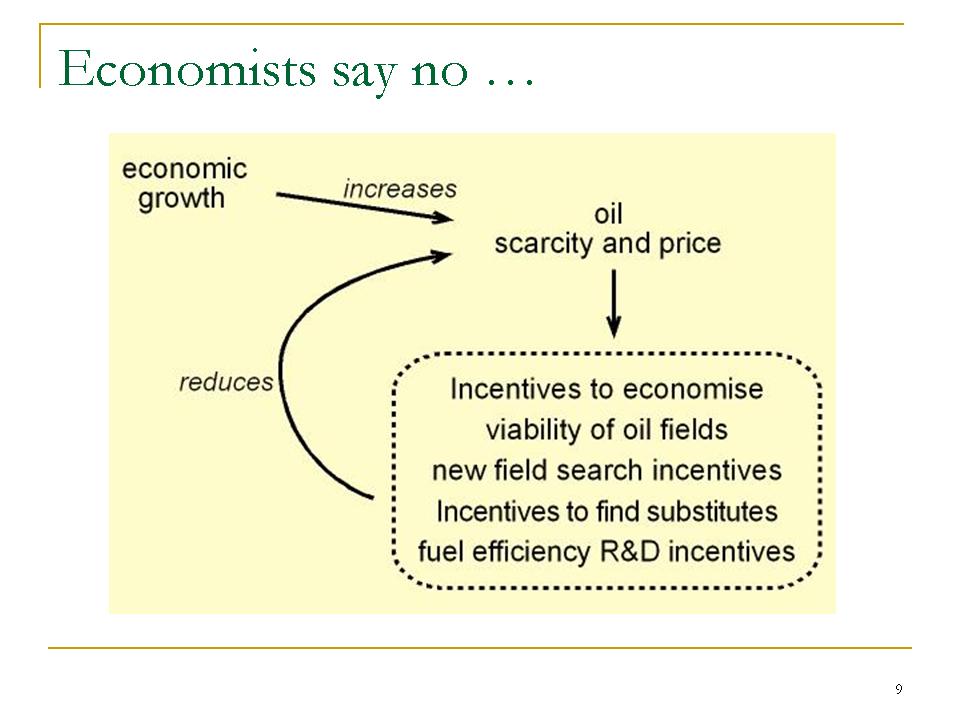
.. and here is how economists see the market reacting in the long run
.....The question is how effective these market responses to increasing scarcity will be in counteracting the problem that stimulated them in the first place. And in turn this can depend on the time horizons we are looking at - eg the time horizon for technological innovation to solve problems of resource scarcity can be years or decades. |
|
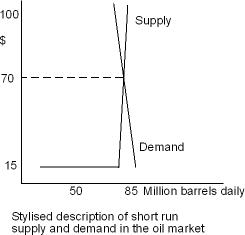
So what about the short run? The diagram on the right here is a highly stylised approximation of what supply and demand might look like at an equilibrium price of $70. Bearing in mind that you cannot infer elasticity just from slope of curves, the diagram embodies highly inelastic supply and demand relationships. Both supply and demand here are relatively unresponsive to changes in the price in the short run. So if something happened to shift either the supply or the demand curve here to left or right, there would be excess supply or demand at the price of $70. The market will be in disequilbrium and relatively small mismatches between supply and demand could lead to major swings in price before equilibrium is restored. |
Source: inspired by a Phillips and Drew analysis of the oil market in the 1990s |
As background to the behaviour of oil prices, see the excellent WTRG website. In particular, see its Oil Price History and Analysis, especially the second graph tracing Crude Oil Prices 1869-2004.
All the information in the archived Oil Price Watches is taken from the "commodities" part of the FT, towards the back of the Companies and Markets section, Tuesday through Friday (the Saturday FT carries a summary fo the week), we take Brent Crude as our standard barrel of oil.